questionlp’s avatarquestionlp’s Twitter Archive—№ 34,861

              1. Currently using Chart.js for the charts and graphs for the Wait Wait Graphs Site; but, now considering switching over to Plotly.js in order to get things like heatmaps. Plus, going from the current version to the next version of Chart.js requires making breaking changes...
            1. …in reply to @questionlp
              That said, I'm a bit hesitant looking at the size of the pre-compressed minified JS for Plotly.js: 3.3 MB 😬 Pretty huge jump up from the 226 KB pre-compressed and minified JS file for Chart.js.
          1. …in reply to @questionlp
            Of course, Plotly.js has a whole lot more chart types, interactive features and user-focused features that Chart.js just cannot compete with. Plus, I can choose to use the Python library; though, it would still require the JS for frontend stuff.
        1. …in reply to @questionlp
          I suppose it's better that I use it on a much lower-volume site compared to the primary Stats Page or the Reports Site. That was why I chose to make them separate sites when I started designing the whole thing: 3 sites for 3 different purposes with possibly 3 different UI/UX.
      1. …in reply to @questionlp
        Well, I've started migrating the charts and graphs over to Plotly.js. It's interesting that the default plotting colors are darn, darn near the original colors that I set for Chart.js that I opted for the defaults. I also had to port over part of the dark mode detection code.
        oh my god twitter doesn’t include alt text from images in their APIoh my god twitter doesn’t include alt text from images in their API
    1. …in reply to @questionlp
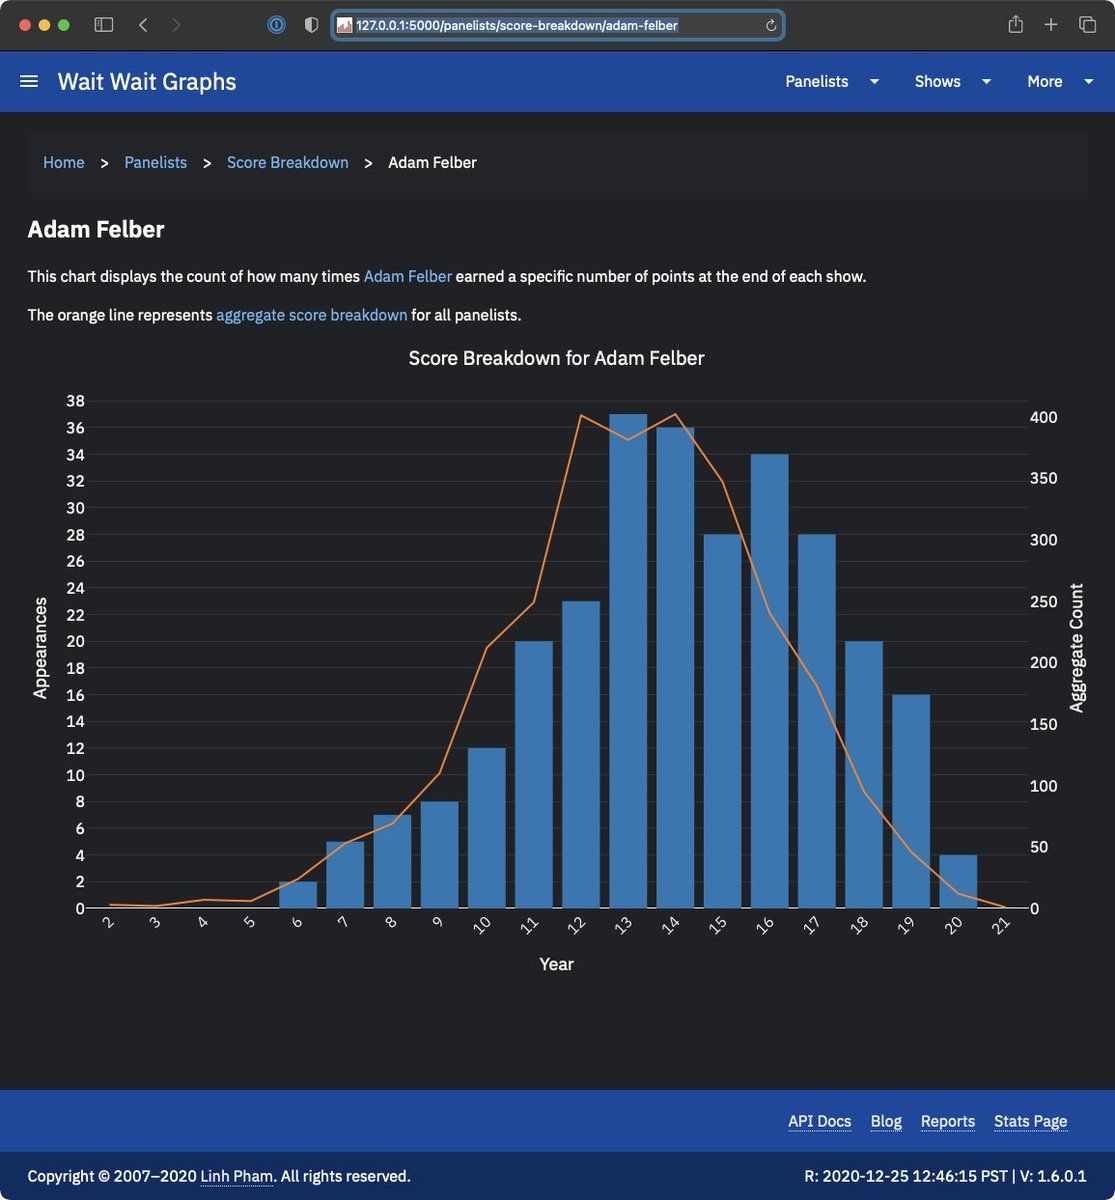
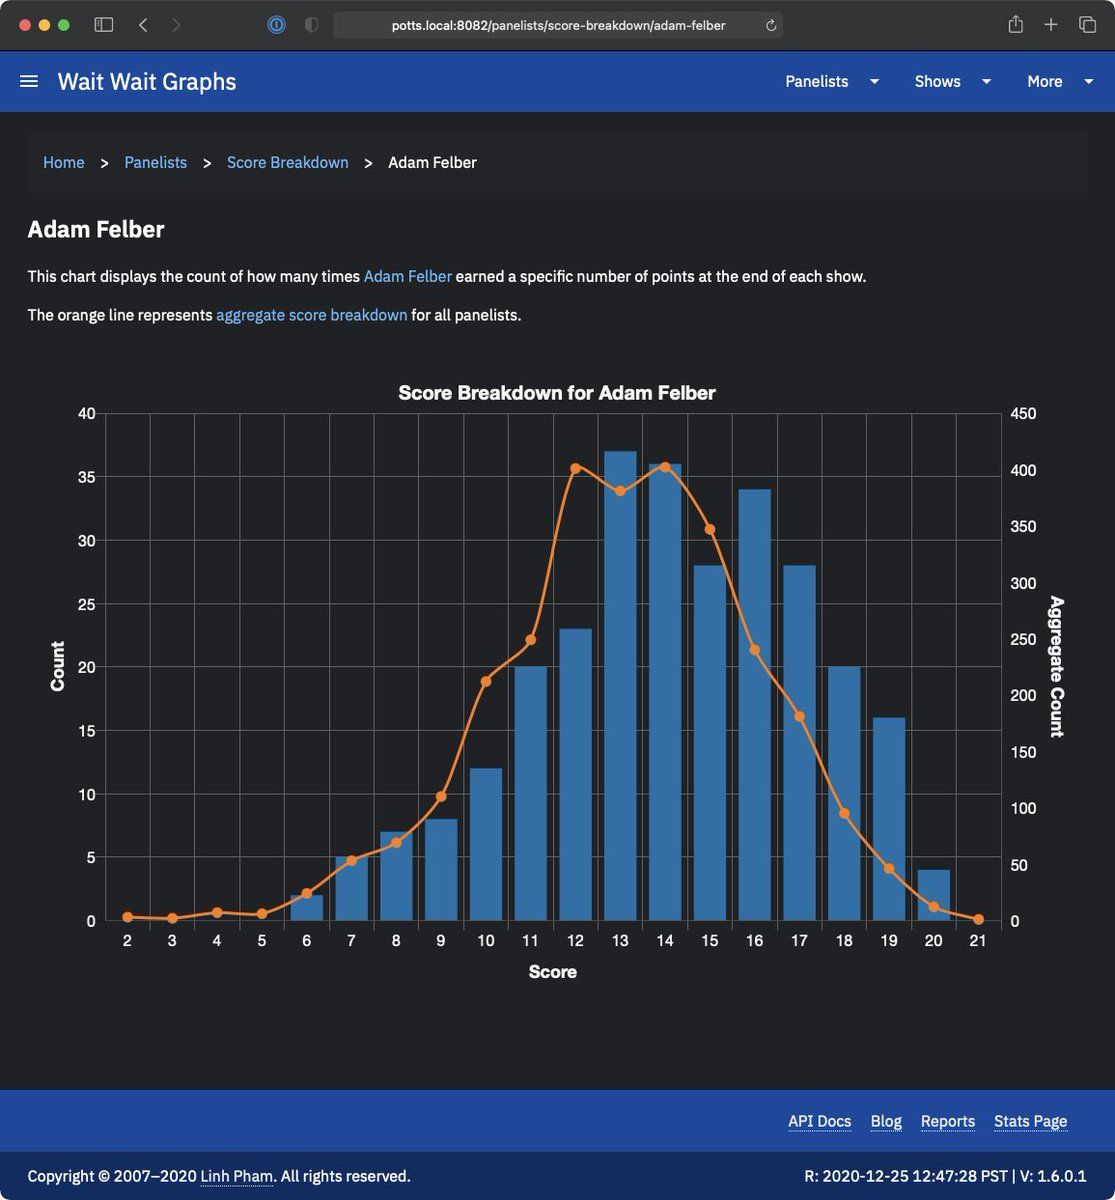
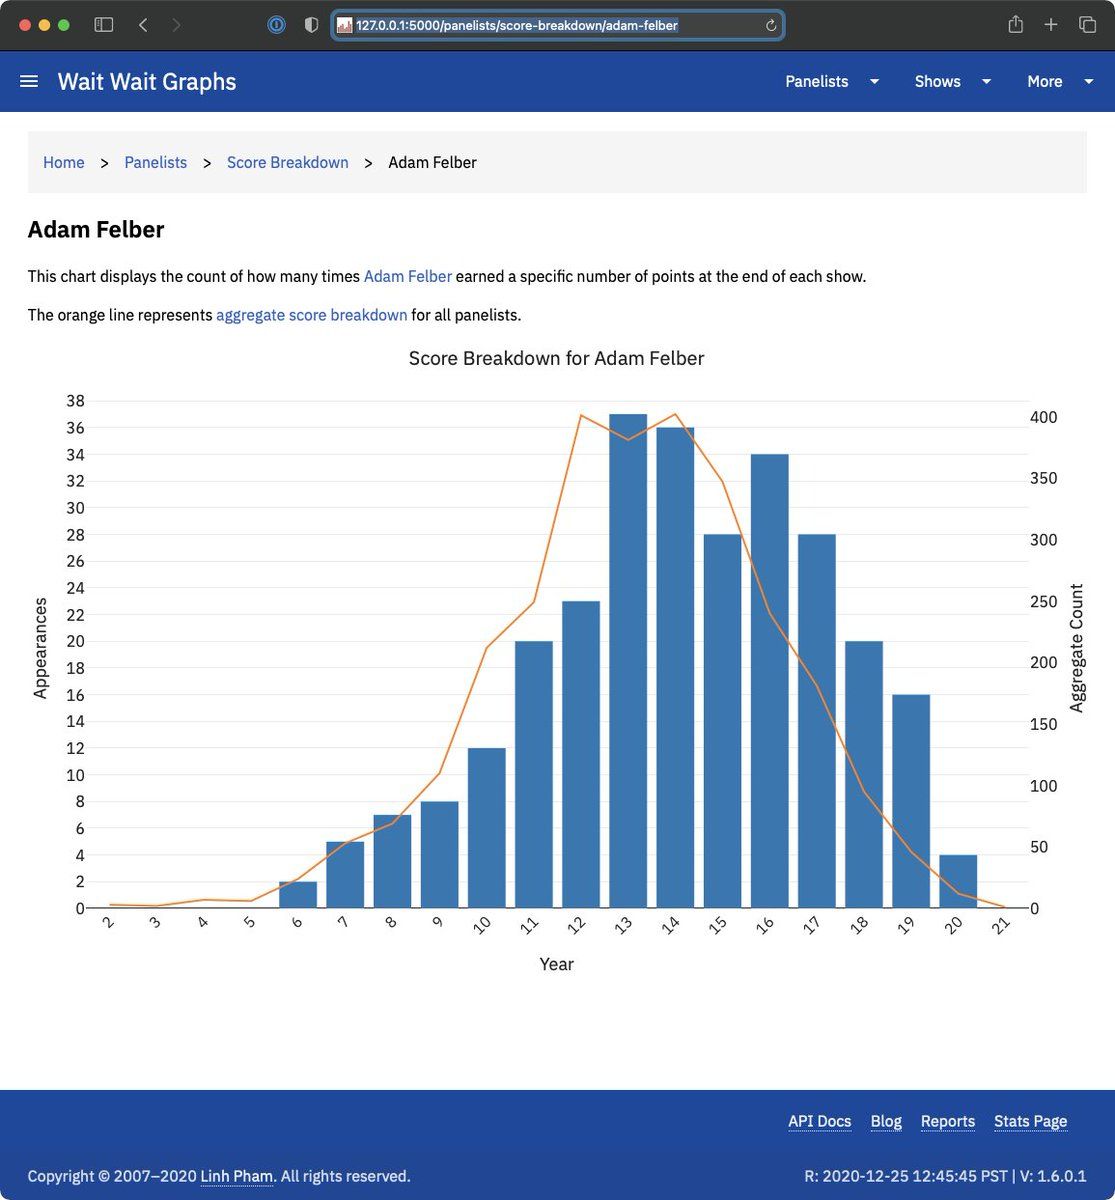
      I've chosen to do away with the full grid lines and opted to only do y-axis lines. I'll might tackle alignment of the two y-axes grids later on. Before After
      oh my god twitter doesn’t include alt text from images in their APIoh my god twitter doesn’t include alt text from images in their API
  1. …in reply to @questionlp
    Darn IE and the lack of Math.max(...array) support...
    1. …in reply to @questionlp
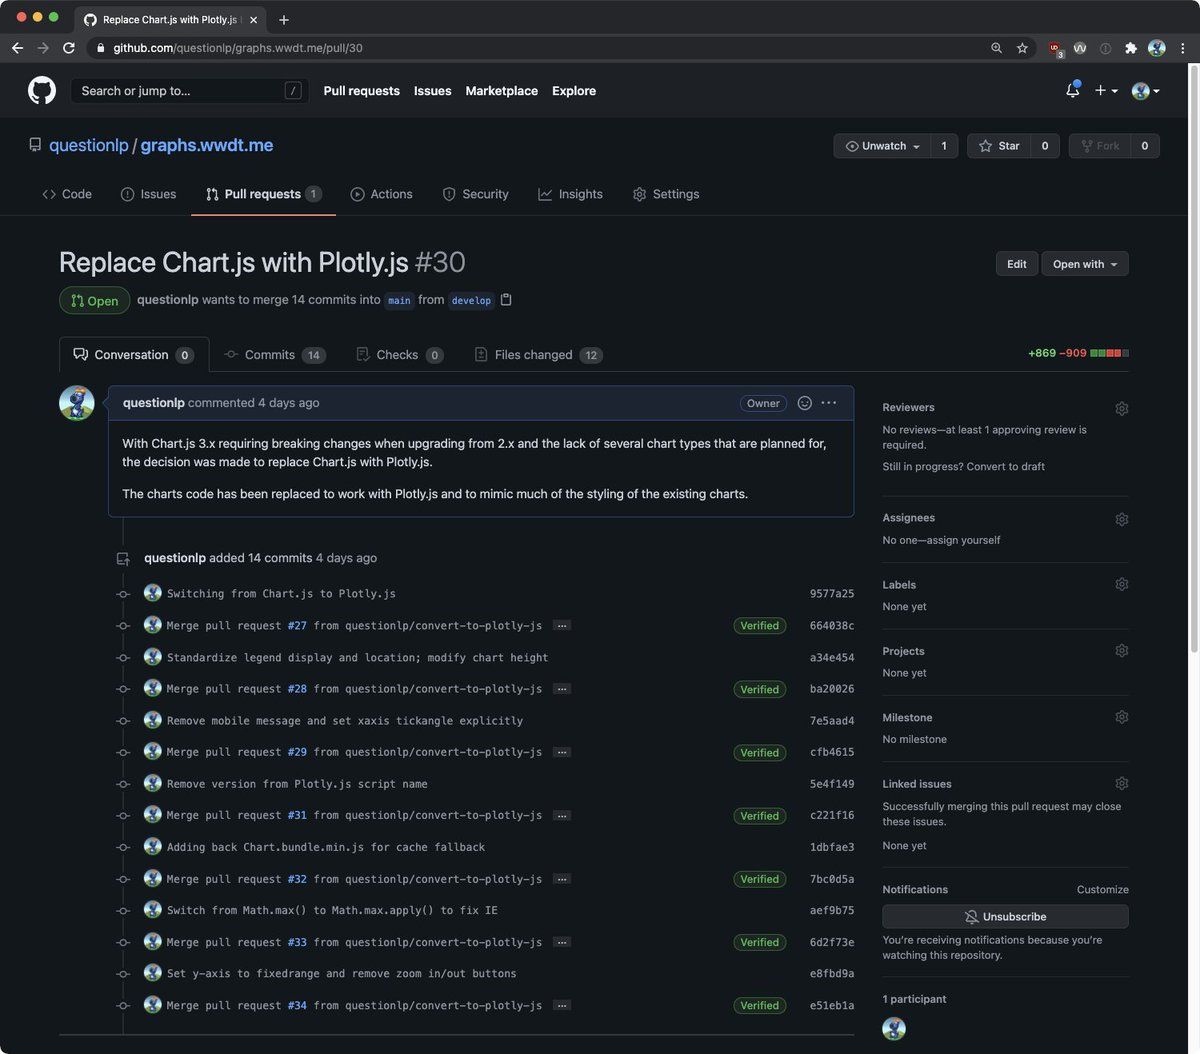
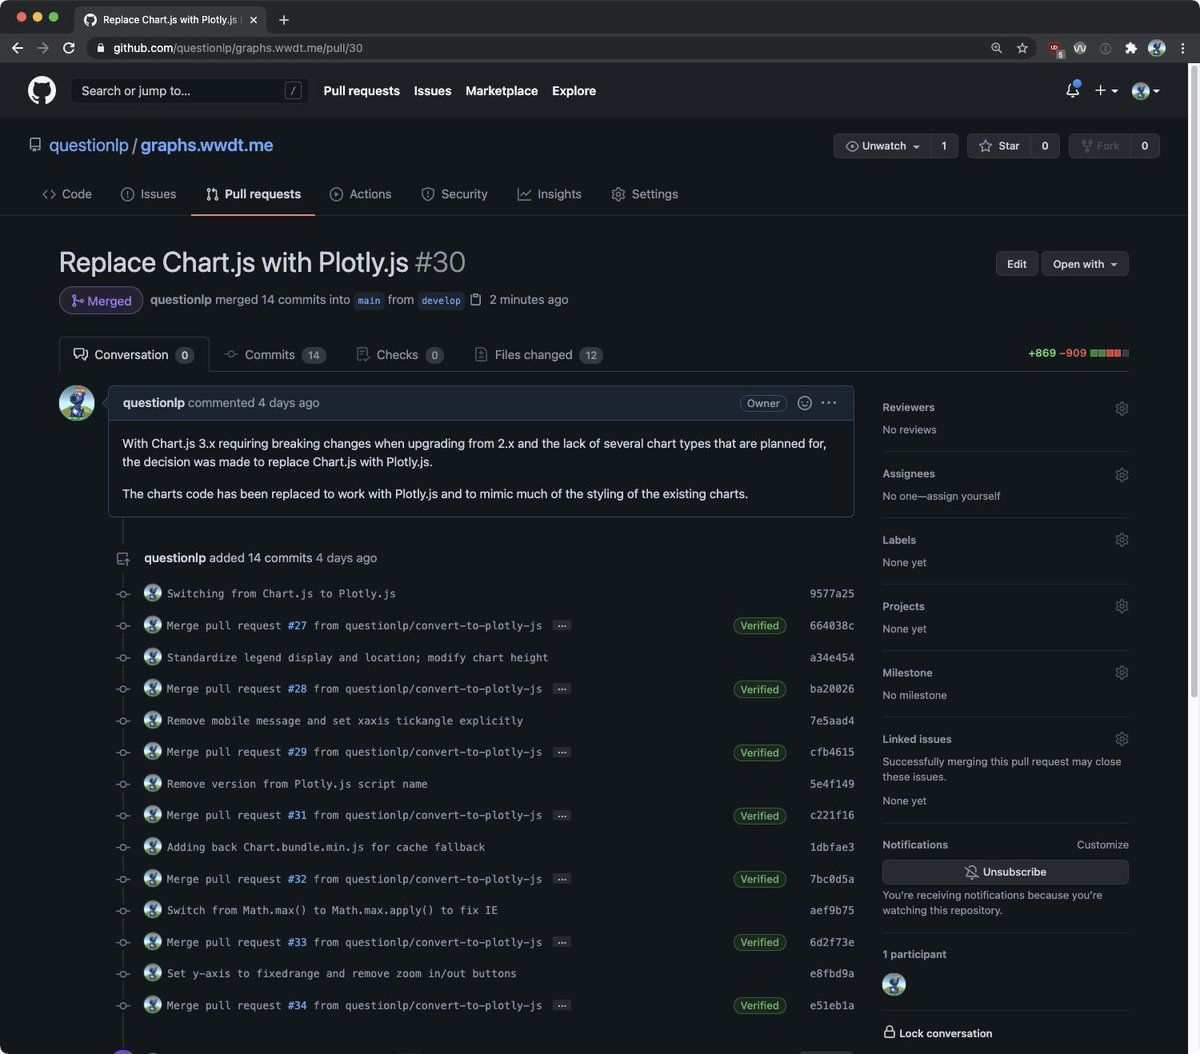
      Well... I think things look good with testing out the cutover from Chart.js over to Plotly.js for the Wait Wait Graphs Site in the test environment. Now, to approve the pull request and get this thing into production! 😬
      1. …in reply to @questionlp
        Well, here goes nothing!
        oh my god twitter doesn’t include alt text from images in their API
        1. …in reply to @questionlp
          The deed has been done. Now, to ship this to the live site.
          oh my god twitter doesn’t include alt text from images in their API
          1. …in reply to @questionlp
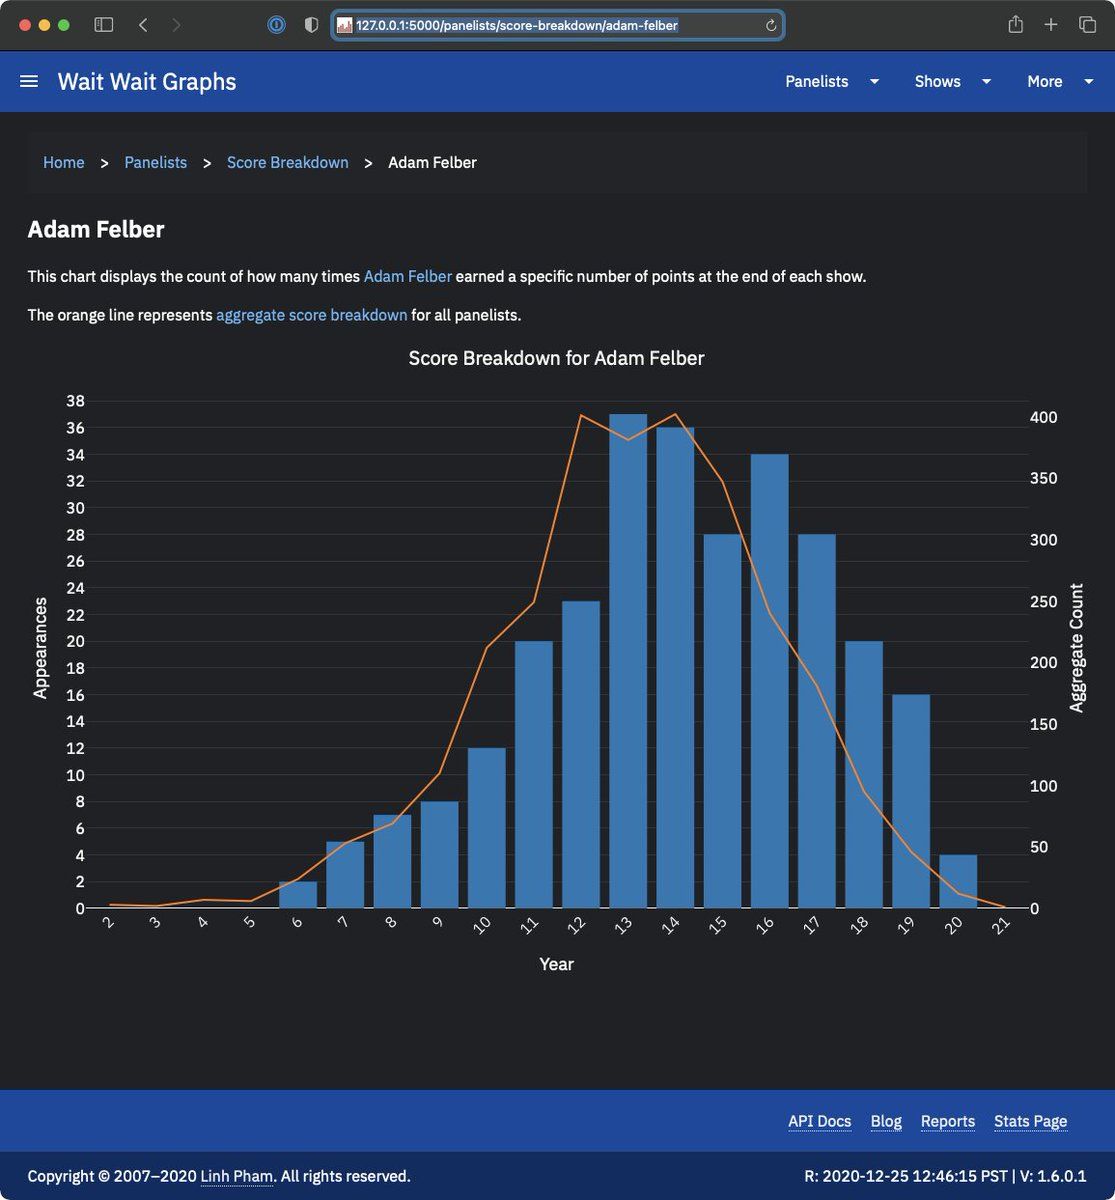
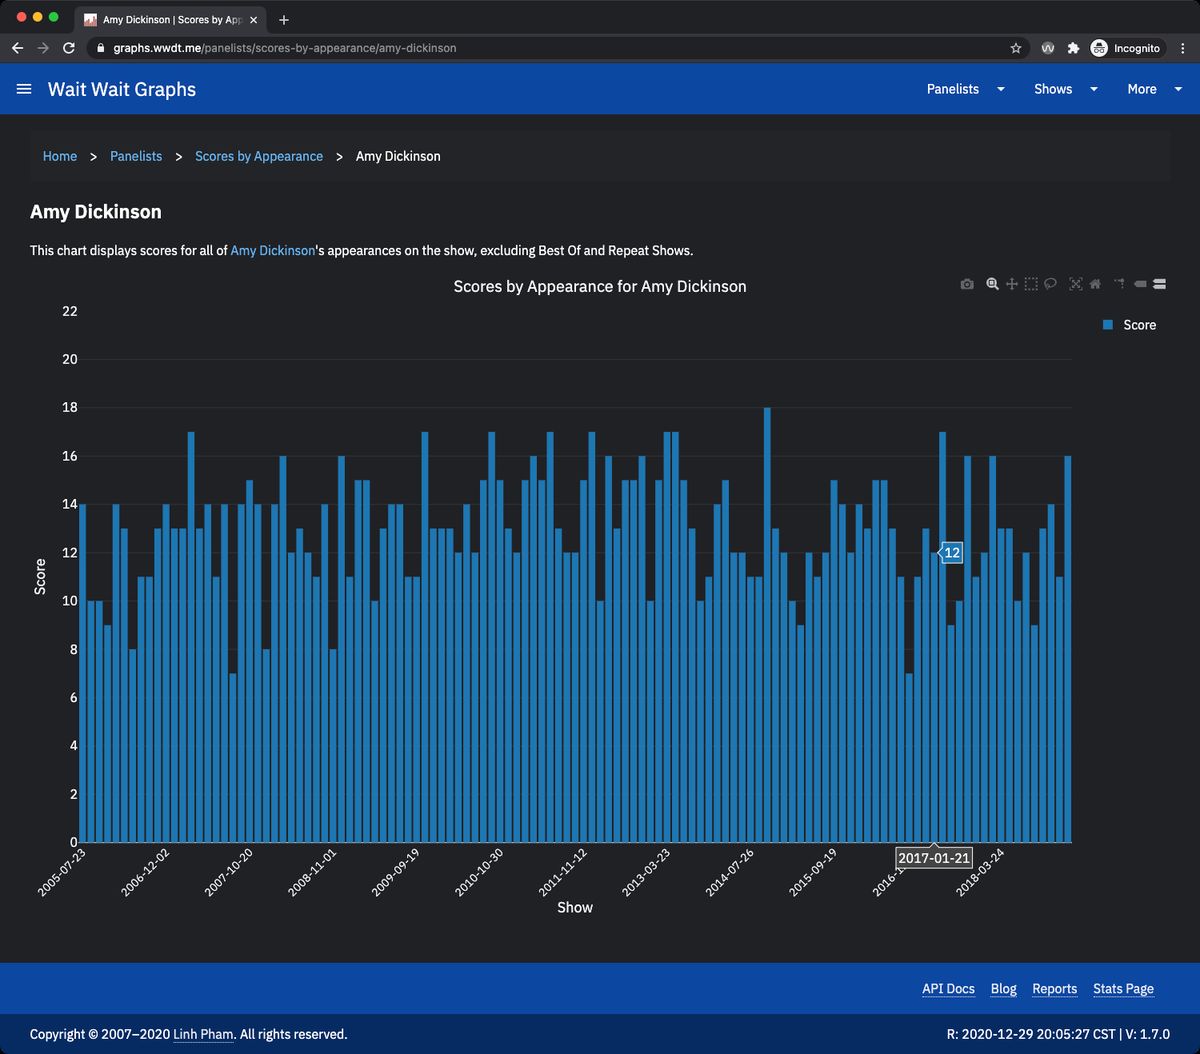
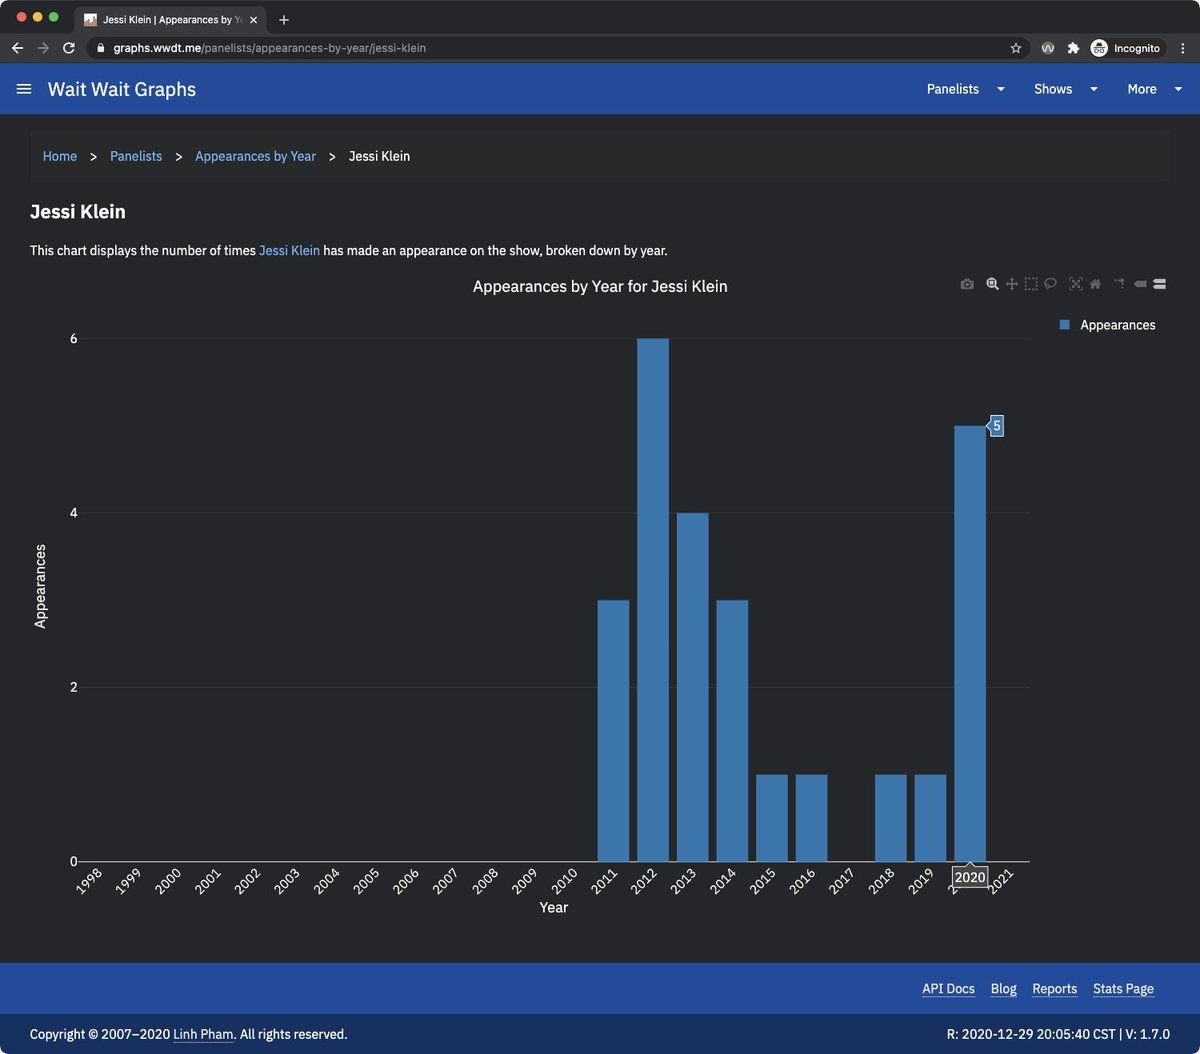
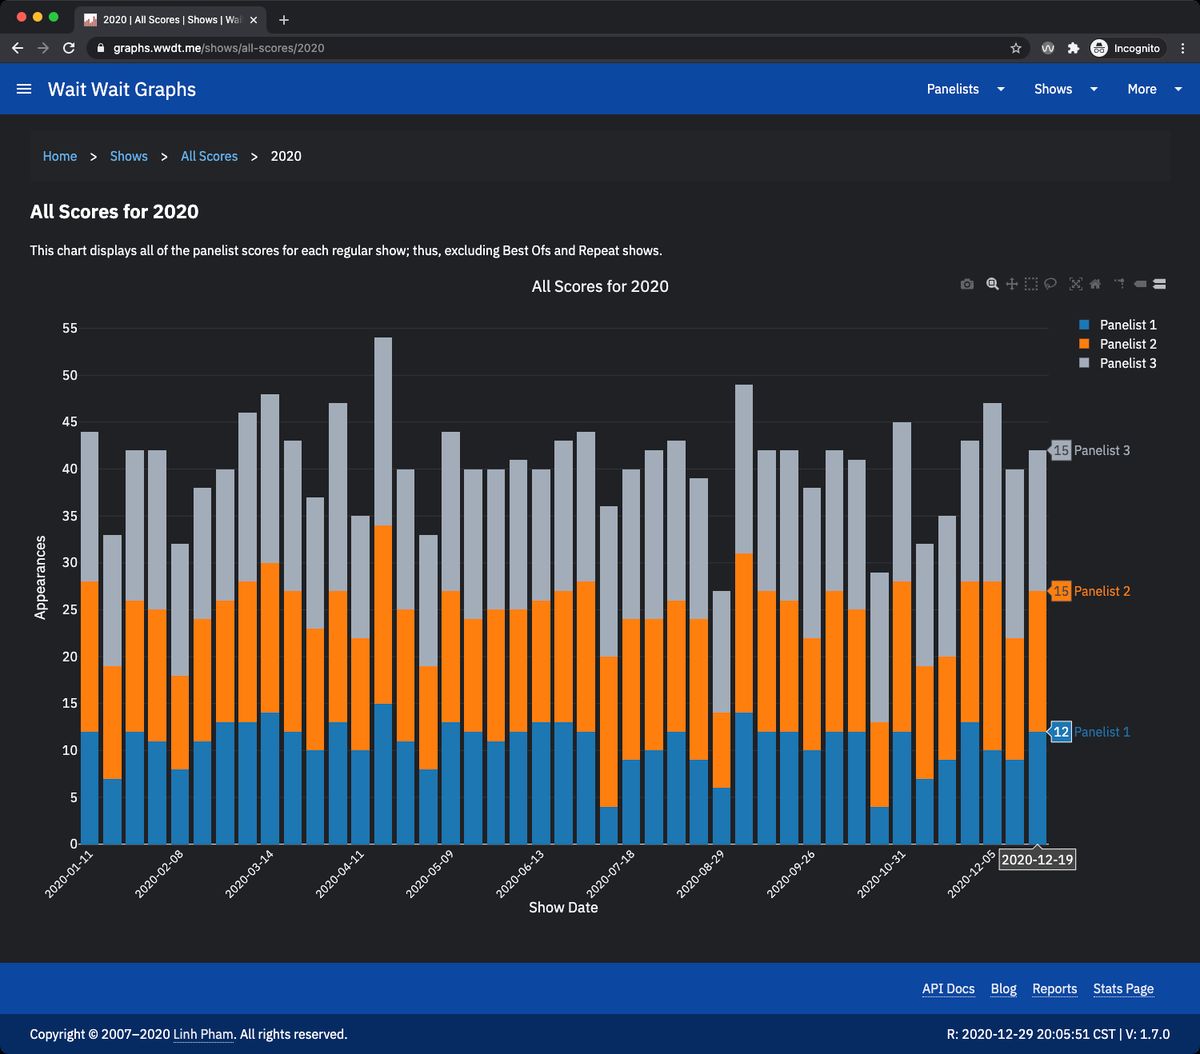
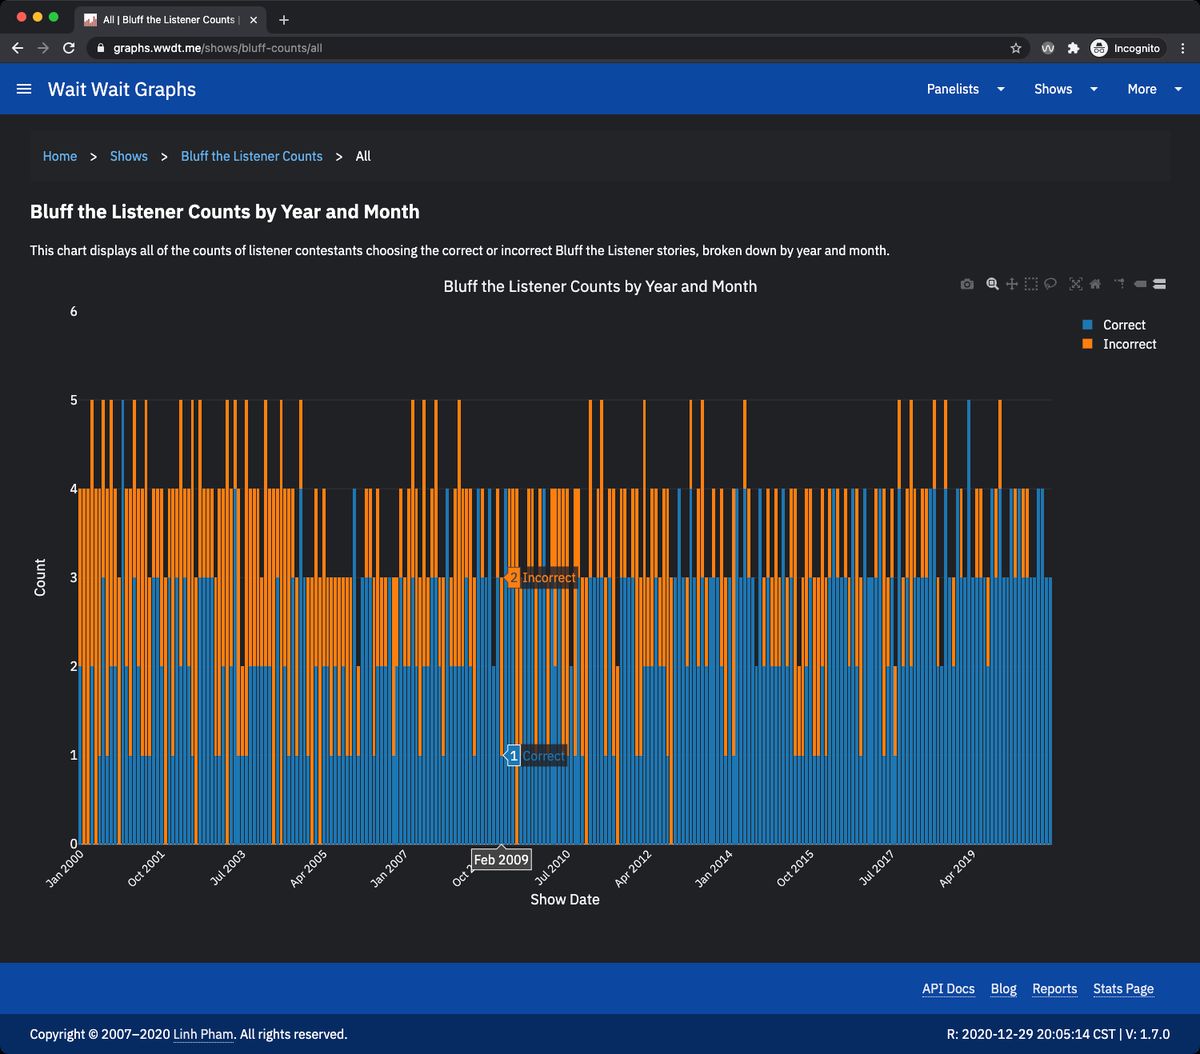
            Code has been deployed and is now live at graphs.wwdt.me! 🎉 Say goodbye to Chart.js and say hello to @plotlygraphs everyone! The charts can now be zoomed and panned for a closer to look at the data and hovers have been simplified and should now render even faster.
            oh my god twitter doesn’t include alt text from images in their APIoh my god twitter doesn’t include alt text from images in their APIoh my god twitter doesn’t include alt text from images in their APIoh my god twitter doesn’t include alt text from images in their API